Middle-Out
- Problem
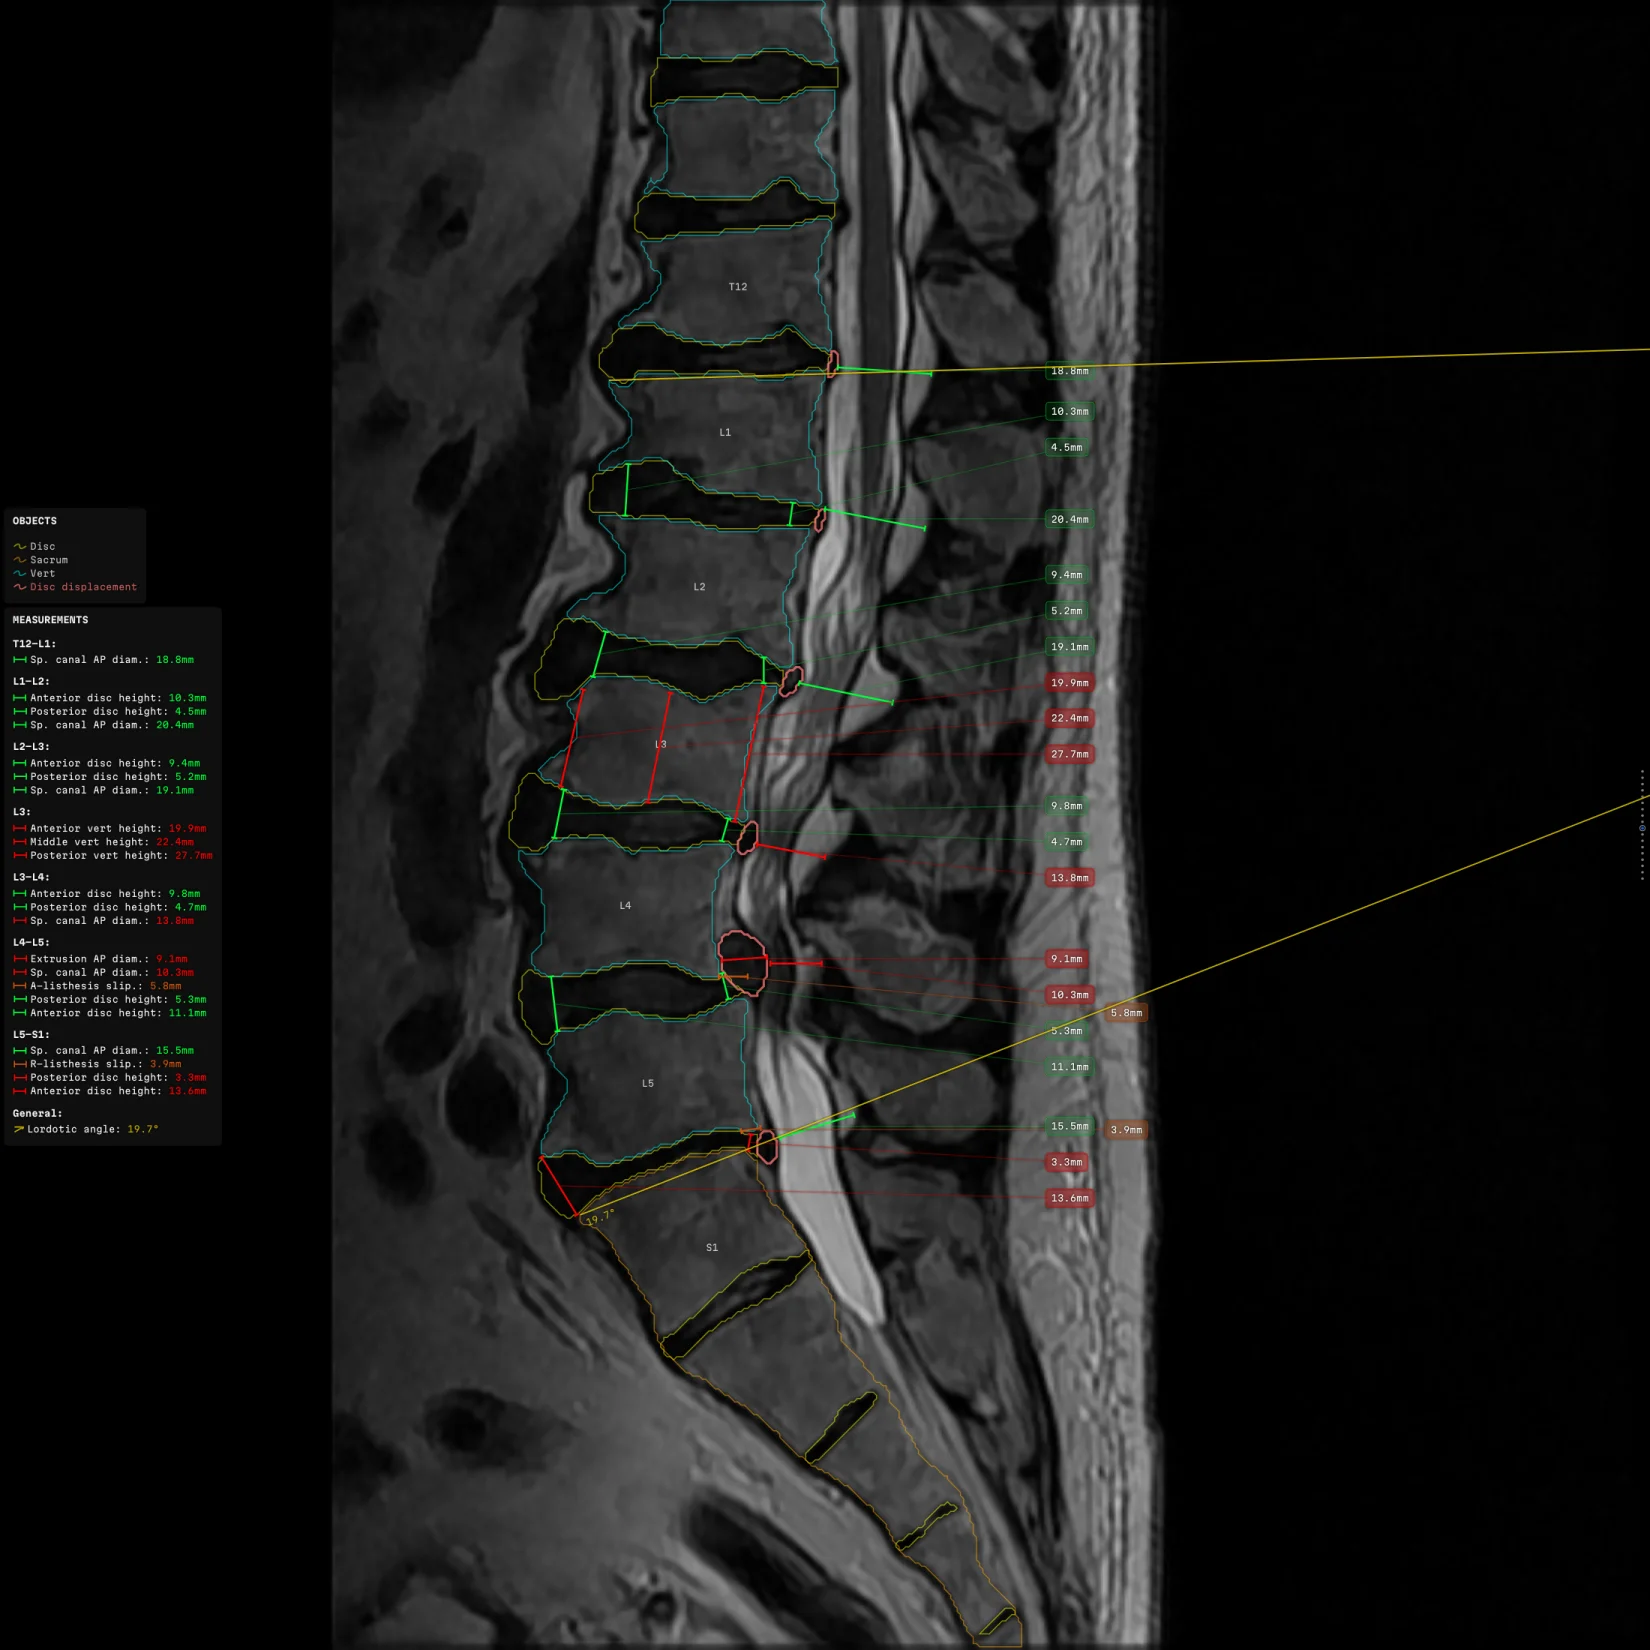
- An analyser finds everything on a spine MRI and returns numbers. Nobody knew what those findings should look like on the image for a radiologist to actually work from them.
- Role
- Designed and wrote both the drawing library and the headless generator that runs it — interface, graphics, logic, algorithms, implementation.
- Purpose
- So a radiologist sees every finding on the slice it came from, beside the evidence for it, and can reject any of them.
- Built with
- TypeScript · Canvas 2D · React · a headless browser for the baked frames
- Where it runs
- Three products at Remedy Logic and the diagnostic viewers of their partners, read by radiologists every working day.
The idea
A line on a canvas is a first-week exercise. A dozen lines with numbers and panels on one spine slice is another job. The reader takes it in at a glance and may argue with any part of it.
Little of that is drawing. It is deciding where each thing goes. There are a couple of hundred pixels of dense grey and a set of rules that contradict one another. Which rule gives way is a question about how radiologists read. Drawing was the easy part.
The library was built at Remedy Logic by the author of this post. The rendering engine and the layout solver. The rules about what may be printed. The configuration every consumer reads, and the headless generator that runs all of it.
A spine MRI arrives as sagittal and axial series1 and leaves as a report. Protrusion at one level. Stenosis at another. Canal diameter in millimetres.2 Everyone downstream rebuilds the spine from those words, with no images in front of them. Findings get missed on the way, and that much is measured.
- The abnormality is never seen. The day-to-day error rate in radiology runs at three to five per cent. Sixty to eighty per cent of those errors are perceptual: the finding is on the image and nobody saw it.3
- The finding is not what the study was for. A lumbar spine MRI holds the whole abdominal aorta. In a cohort of 1922 patients over fifty-five, an aneurysm was present in 4.4 per cent and reached the report in 31 per cent of those.4
A radiologist reads all shift in the dark with a queue waiting. The overlay exists to help with that.
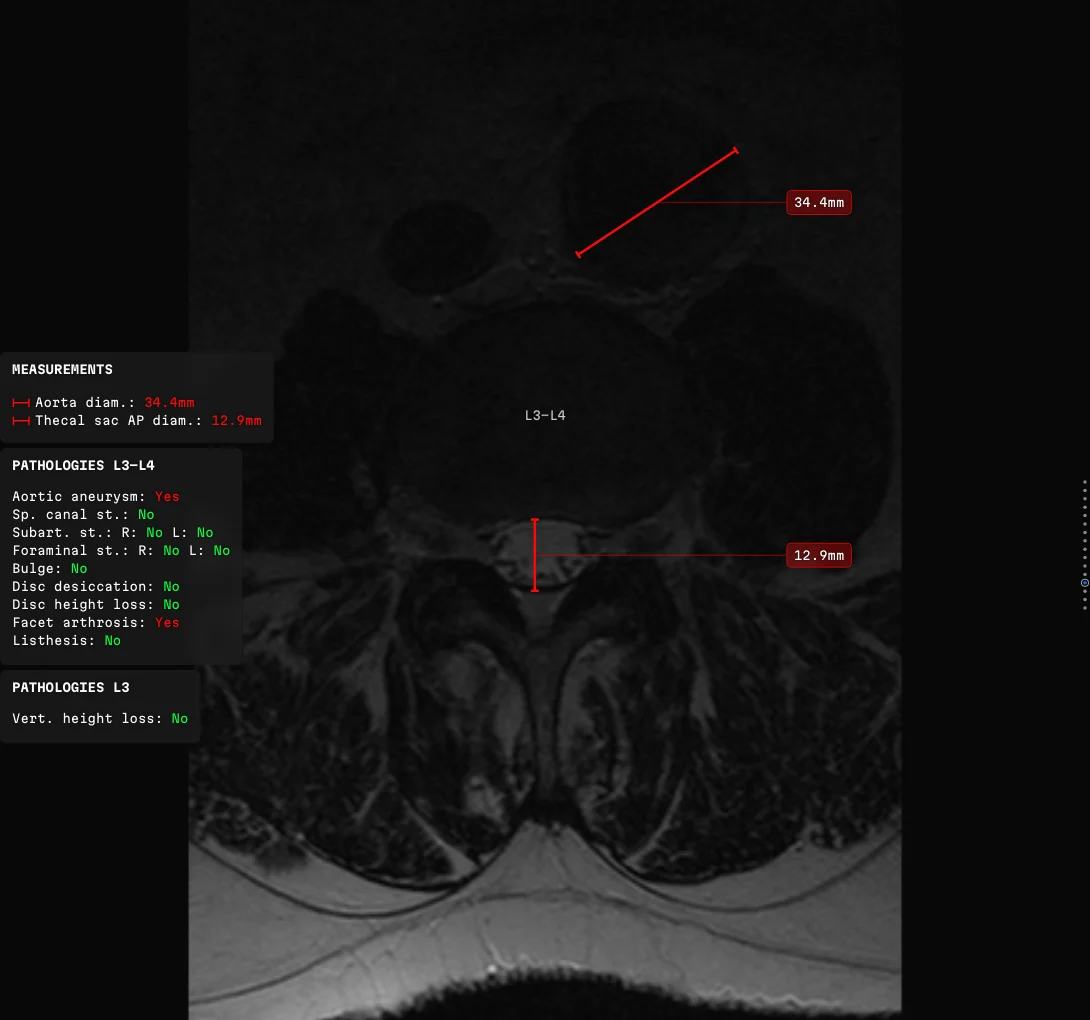 An aneurysm on a study ordered for the spine. The red is the analyser's verdict rather than the drawing's emphasis.
The analyser that finds those things is a colleague's work inside the company. Per slice it hands over contours and the measurements taken across them. Then the findings, with their severity. None of it is a picture. This work starts where the numbers arrive.
What a radiology co-pilot is
The product reads alongside the radiologist. It says what it saw and where, including the finding the reader has not reached yet. The radiologist still decides. One available decision is that the finding is wrong.
The analyser's own 510(k)5 summary puts the checking of its outputs on the user.6 Almost every rule below comes out of that one sentence.
An assistant you cannot disagree with is one you must either trust blindly or switch off.
Three things follow. The evidence for each finding stays on the image. Every finding handed over gets drawn. Labels stay off the anatomy they describe.
So the reader is never simply told there is something at a level. They are looking at it. The measurement is drawn across the thing measured, in a colour that says how bad it is. Claim and evidence in one glance.
That leaves the layout one rule it cannot argue with. Every value goes beside the thing it measures, however crowded the slice.
A number trimmed to fit is a different number.
What is drawn, and what for
Outlines say which structure the analyser believes it is looking at. Contours rather than filled masks. The claim is about the anatomy underneath, and a filled shape covers up the evidence for it. Linear measurements are drawn across the thing they measure. The line shows the value was taken in the right place. Areas carry the same duty. Angles describe alignment. That is the one quantity the eye cannot guess.
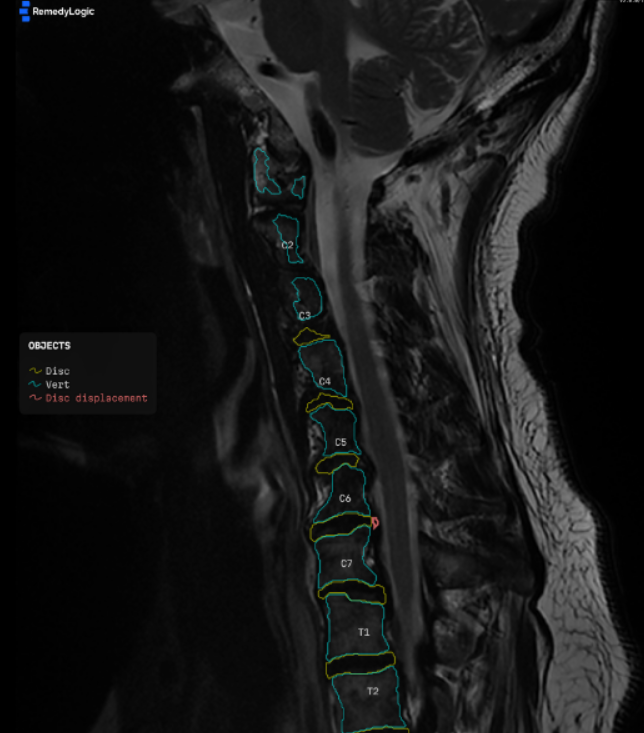
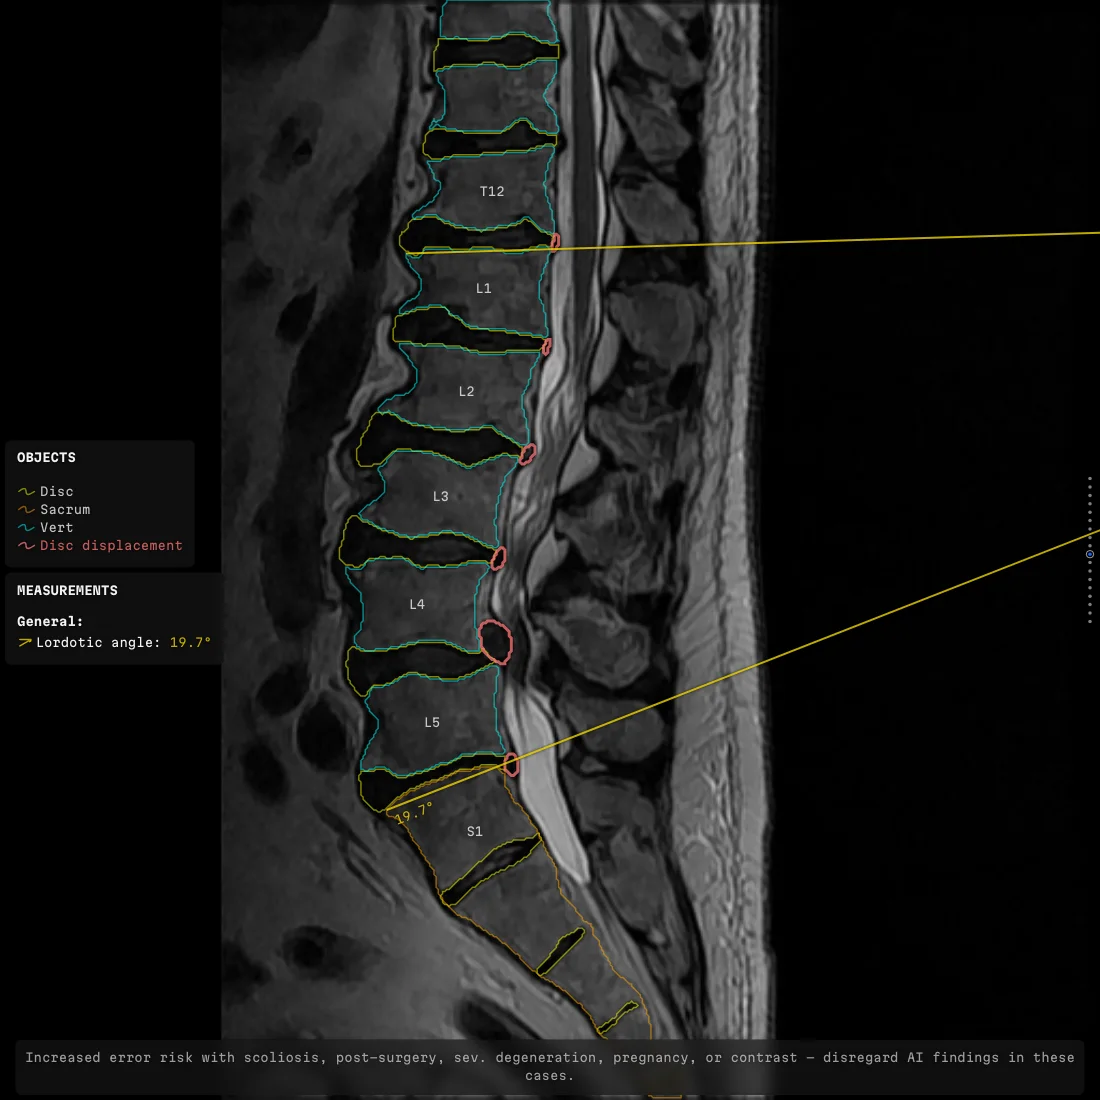
Colour encodes severity. Colour is the loudest channel on the frame. The eye sorts it before attention arrives. It can be spent once, and it is spent on the grade. The findings panel says in words what was found at this level. Always in the same corner. The navigation strip shows where in the stack the slice sits. Losing it is how people scroll past the level they wanted.
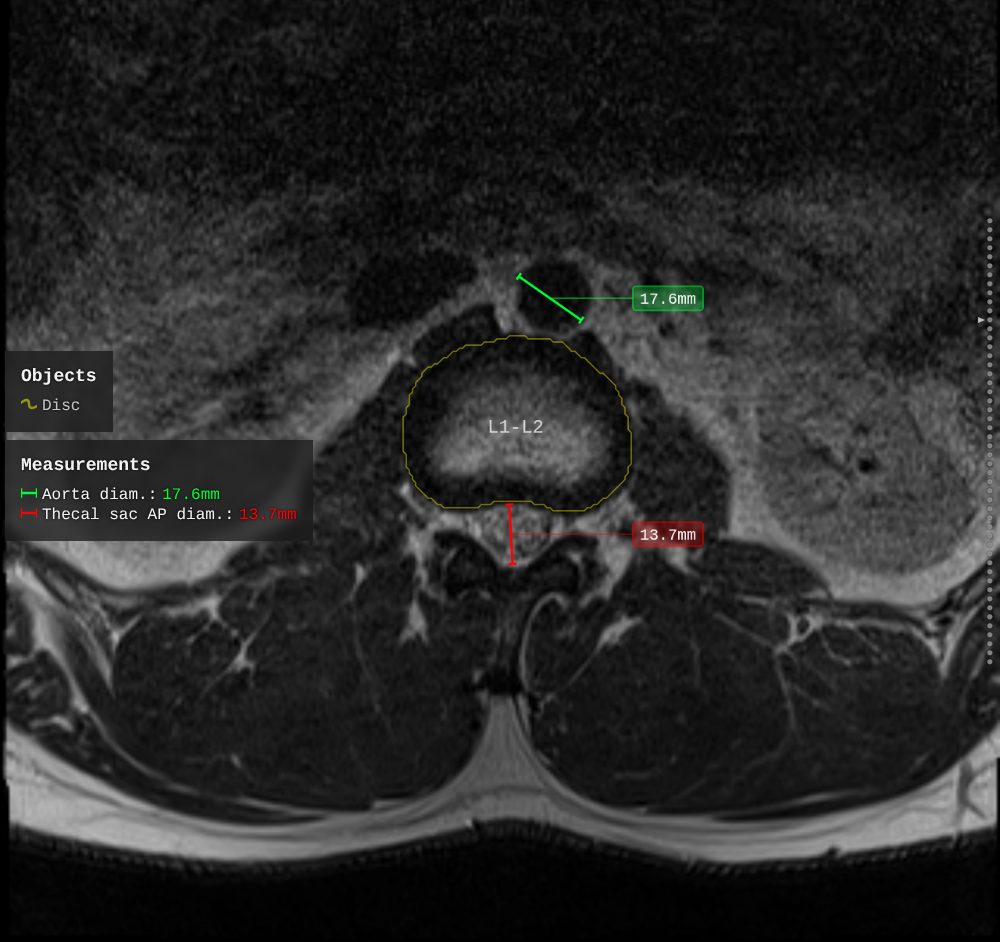 Two colours are two severities. The value on the anatomy and the value in the panel come from one row of the grade table. They cannot disagree.
 One level's findings, worded by the configuration. "Bilateral" is a sentence of its own, because it names neither side. Two of the five carry no grade. For those, only the fact is reported.
Every layer switches on, off, recolours or reshapes from one configuration. No code. Of the 329 visibility switches in the base, 263 are off. The base is the vocabulary. The consumer writes the sentence.
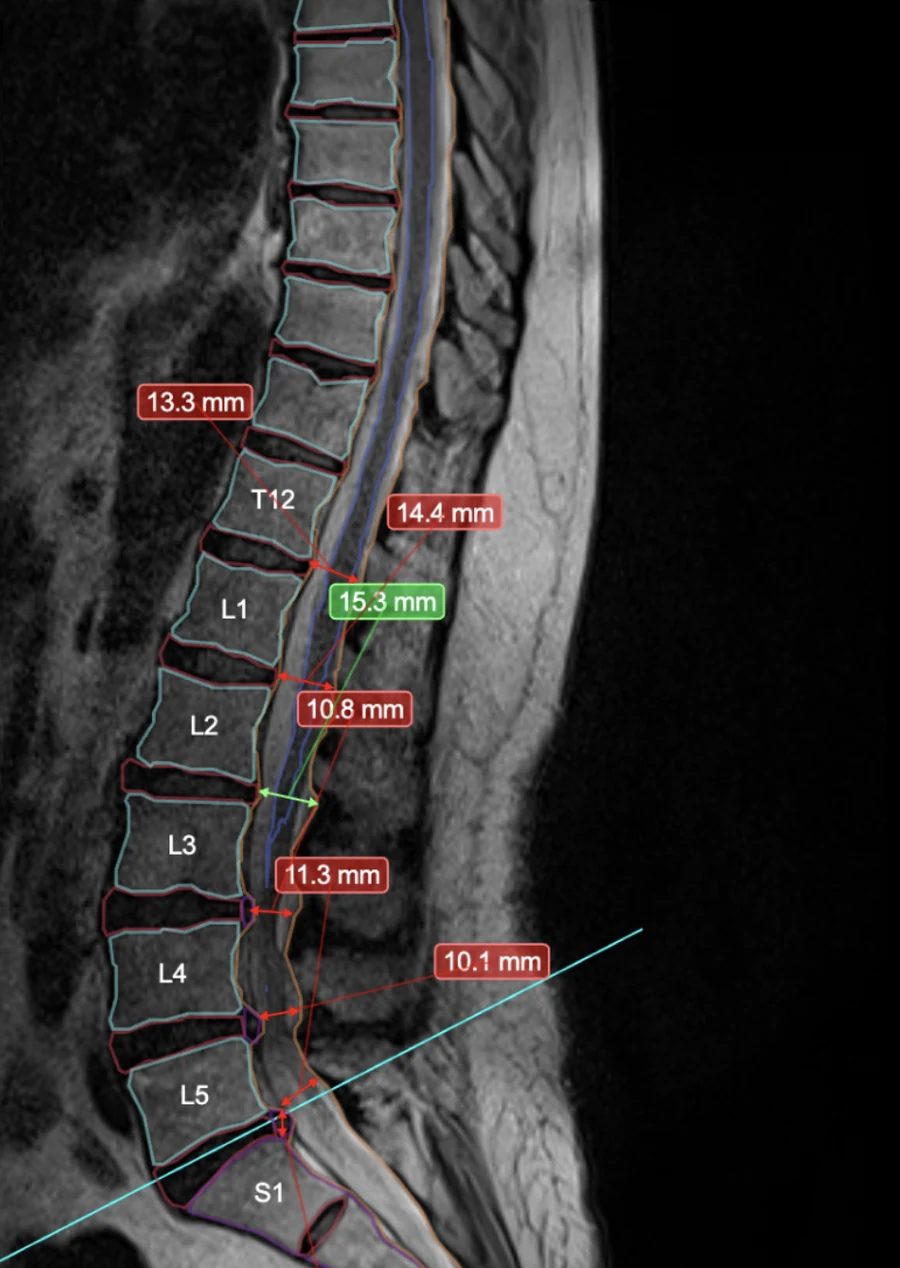
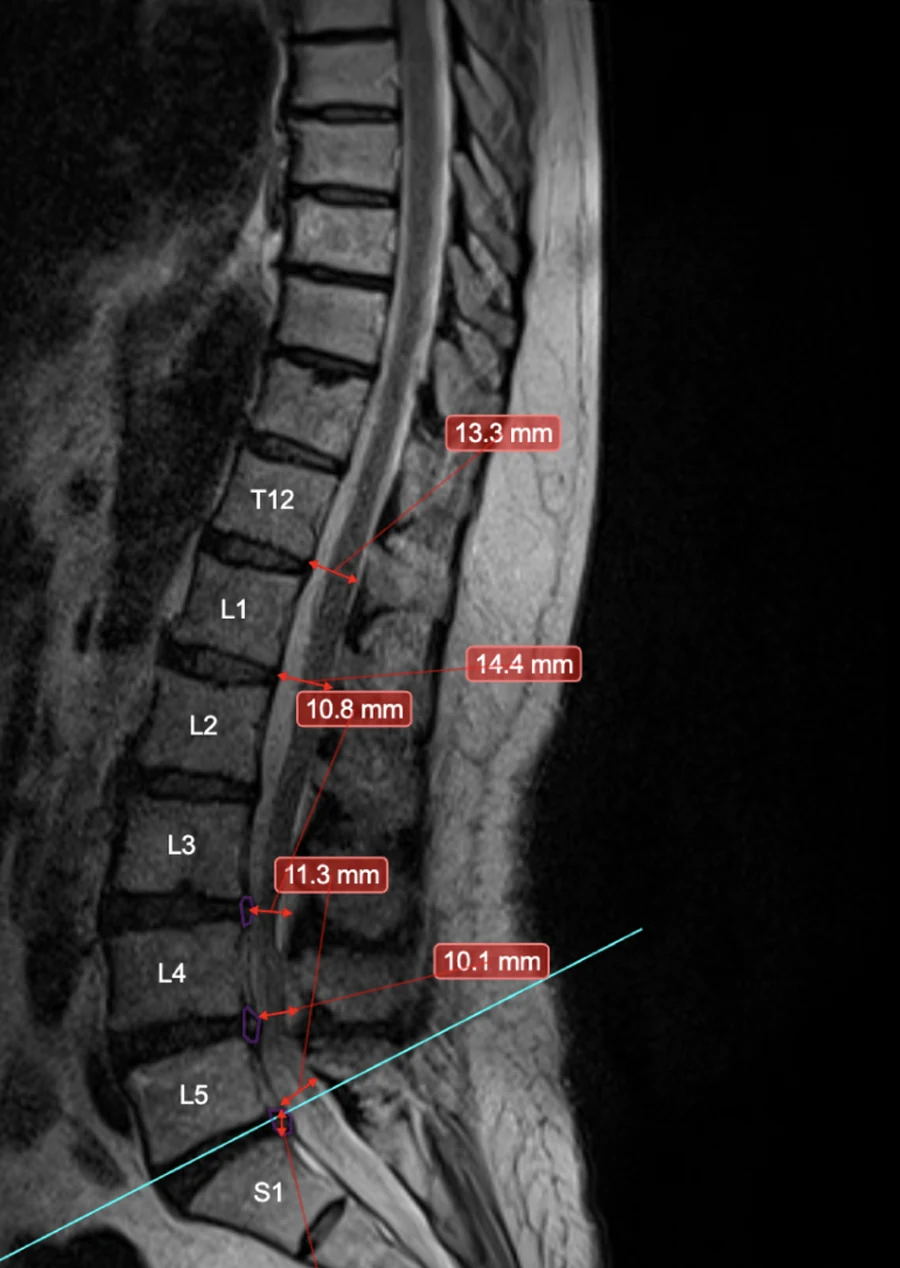
The overlay draws less than it is handed, on purpose. A measurement is dropped when the drawn line would misrepresent the anatomy under it. An axial slice cut at a strong tilt, for one. A line a reader cannot check is worse than no line. Over thirty-eight studies, drawing everything on offer would add 8.9 per cent more measurements and 3.8 per cent more text.
The picture is not an illustration of the result. It is how the result is read.
How it reaches the reader
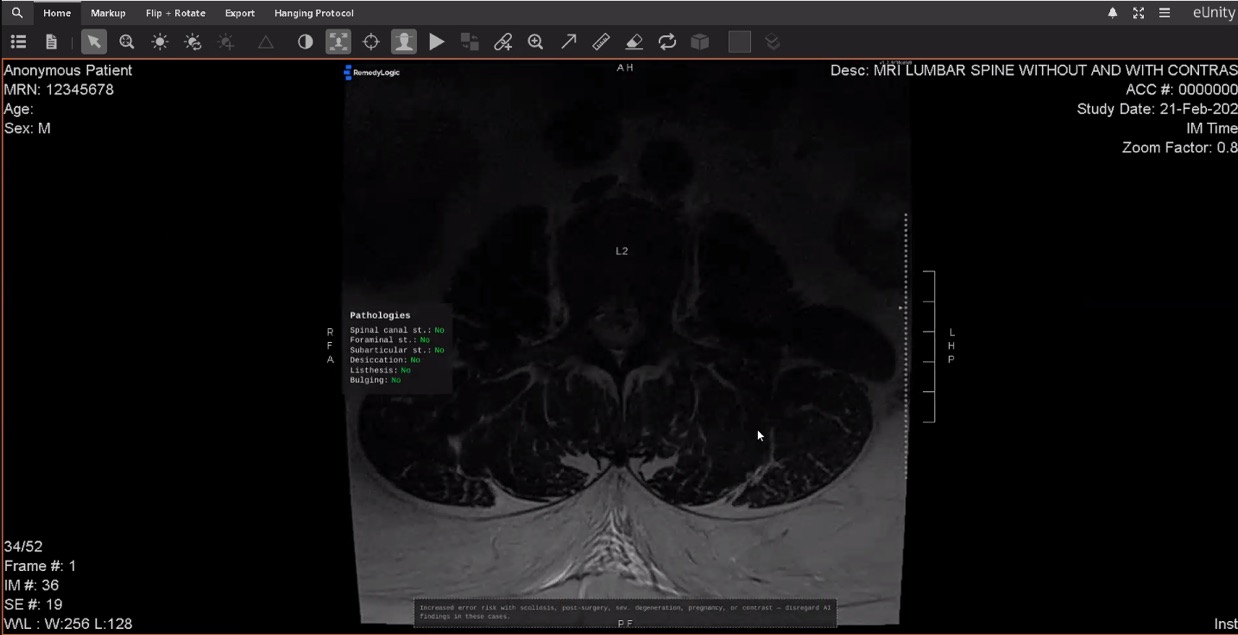
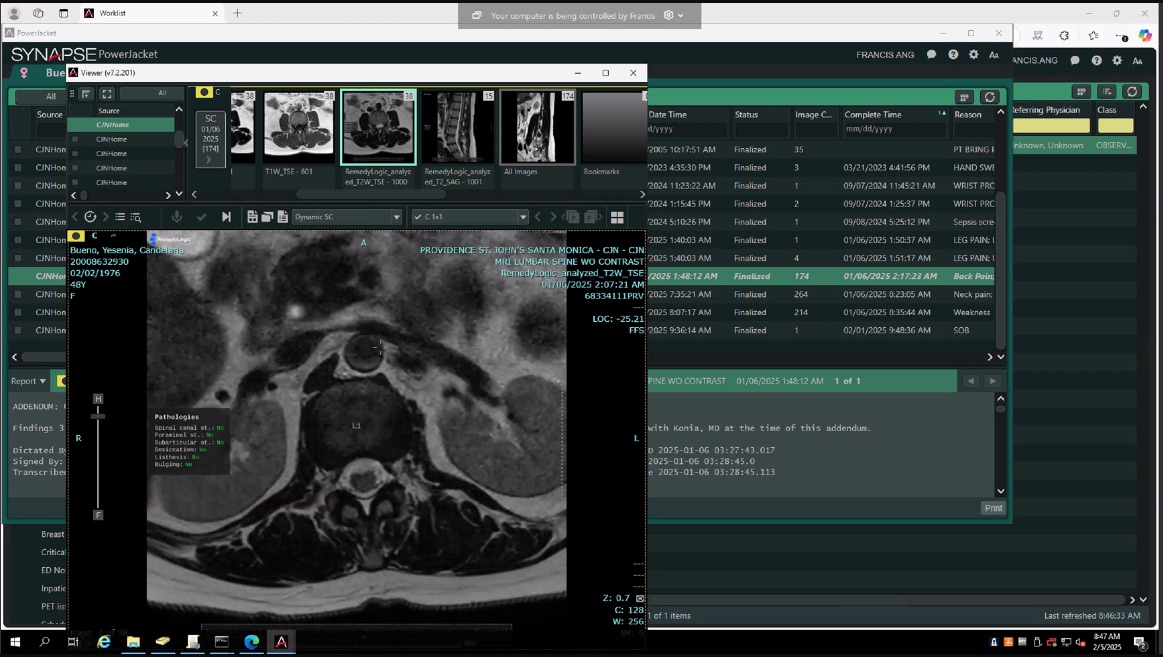
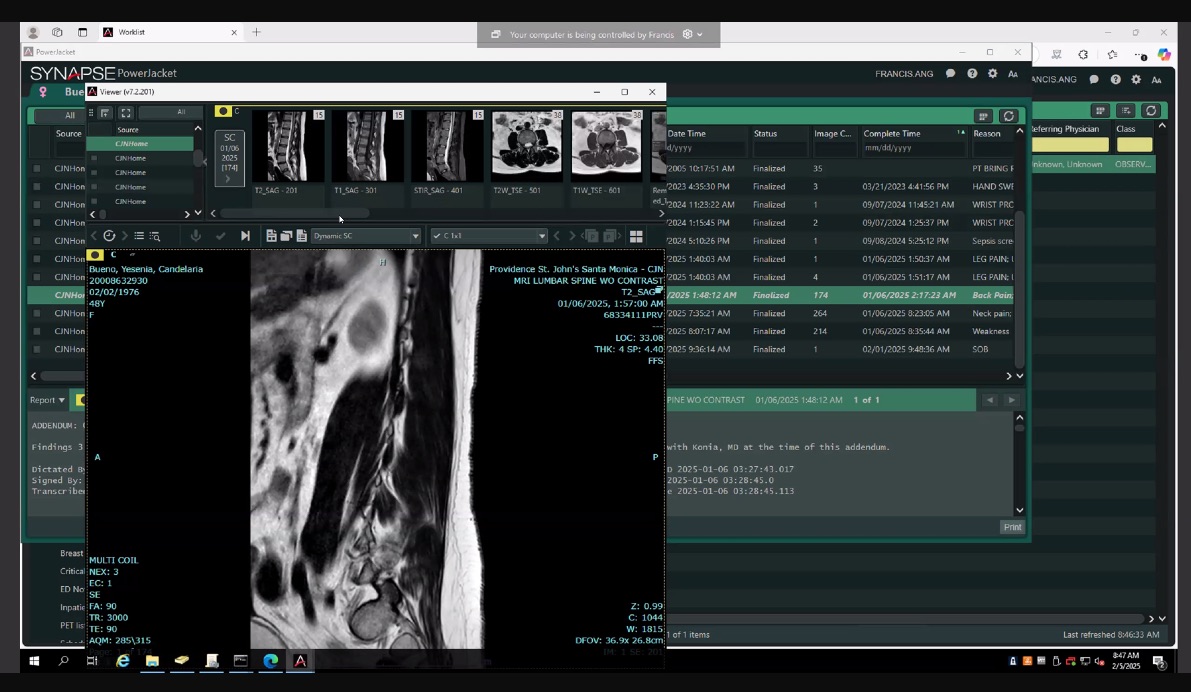
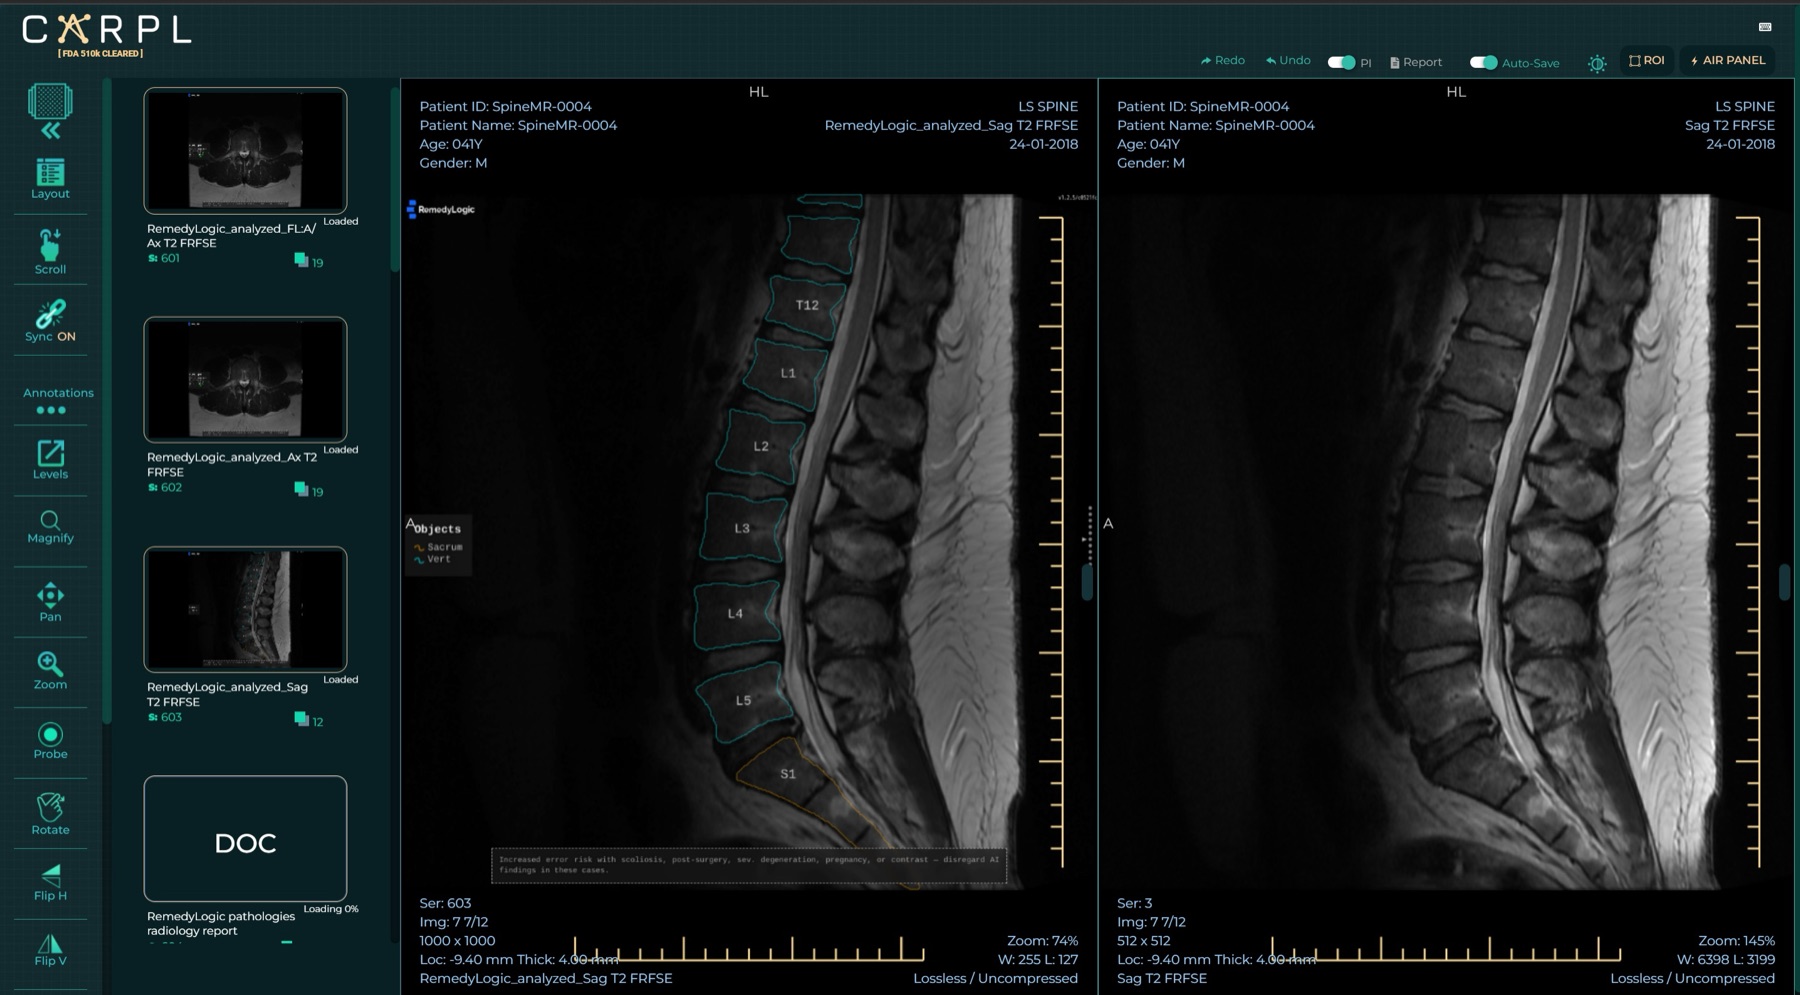
A headless generator7 renders the frames ahead of time in a private cluster. They are packed into a series beside the original study.8 Most radiologists meet the overlay that way. The second path draws the same overlay live, on a viewport the reader pans and zooms.
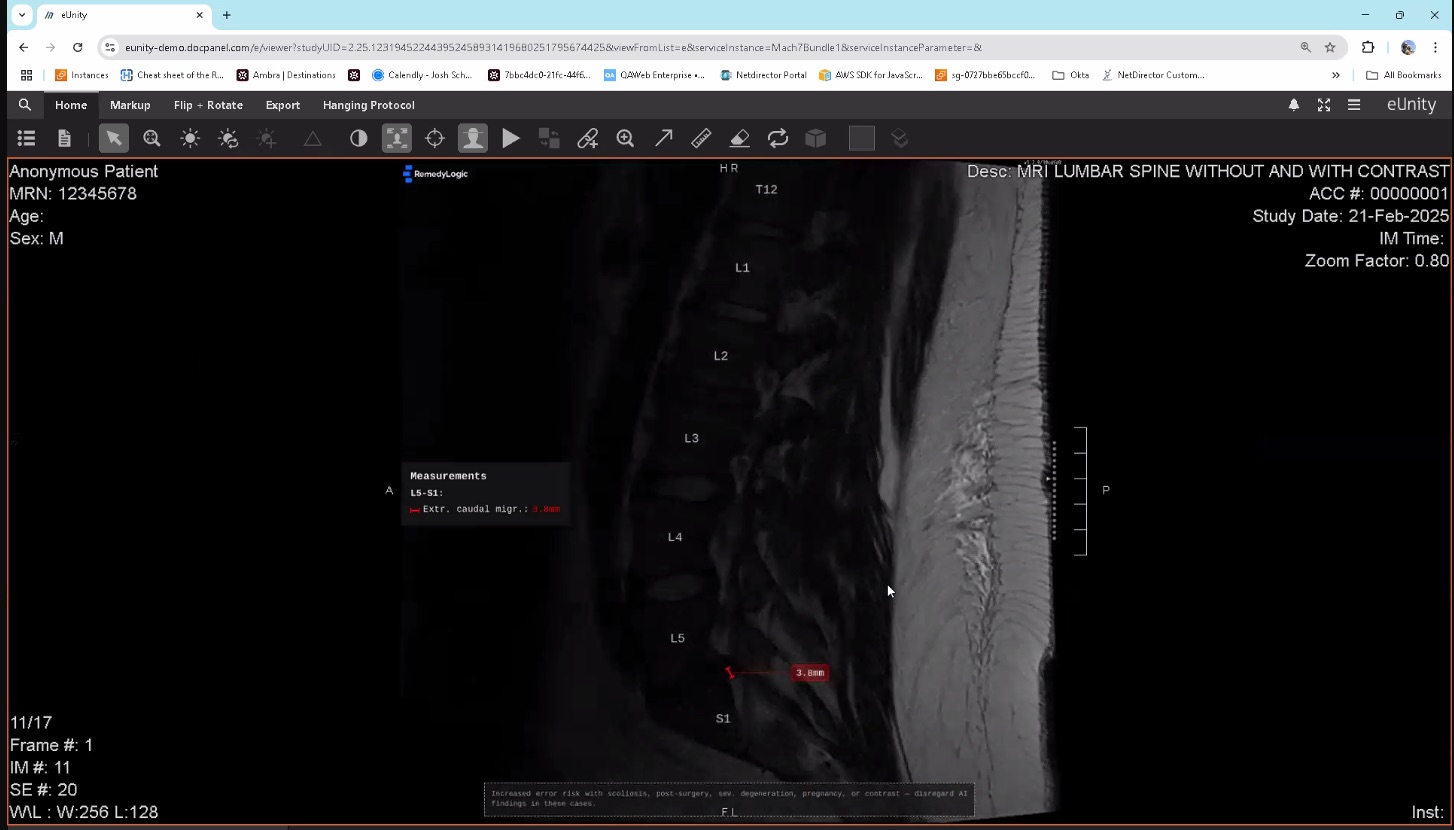
Why this had to be built
A finding is worth something on the slice it came from, beside the evidence. Move the number into a table and the link goes with it. The reader rebuilds it from a level name, against a picture they are no longer looking at.
Most products in spine imaging keep the numbers off the anatomy. A table, or an empty margin where placing them costs nothing.
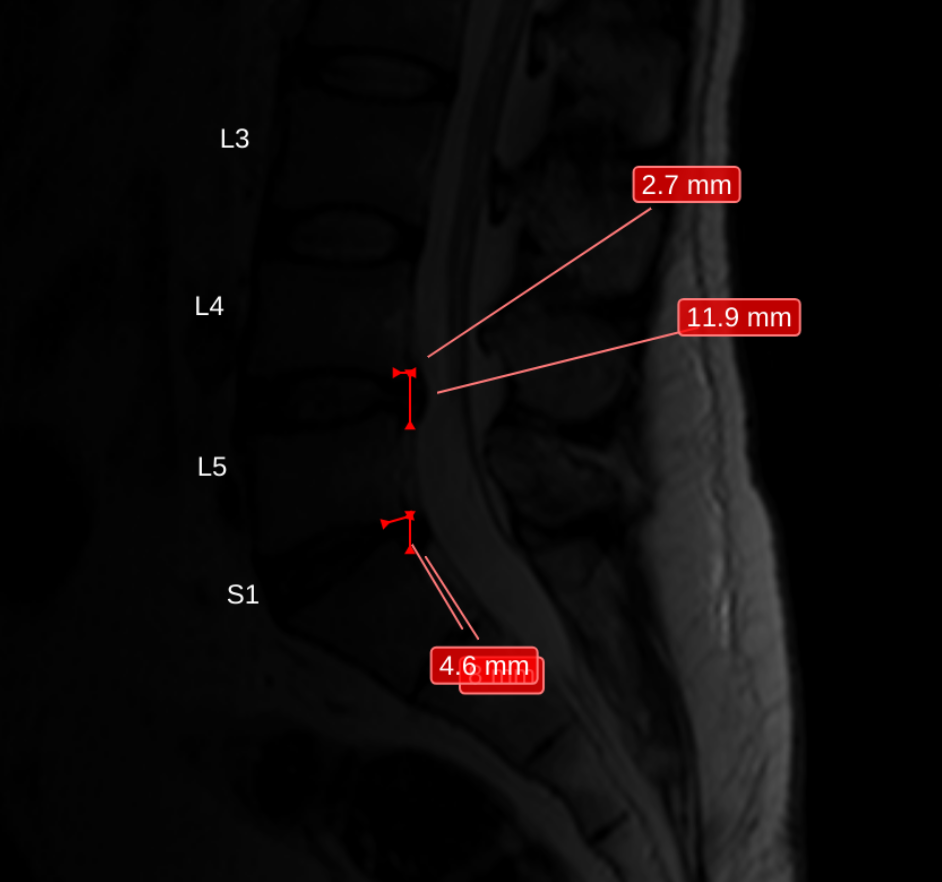
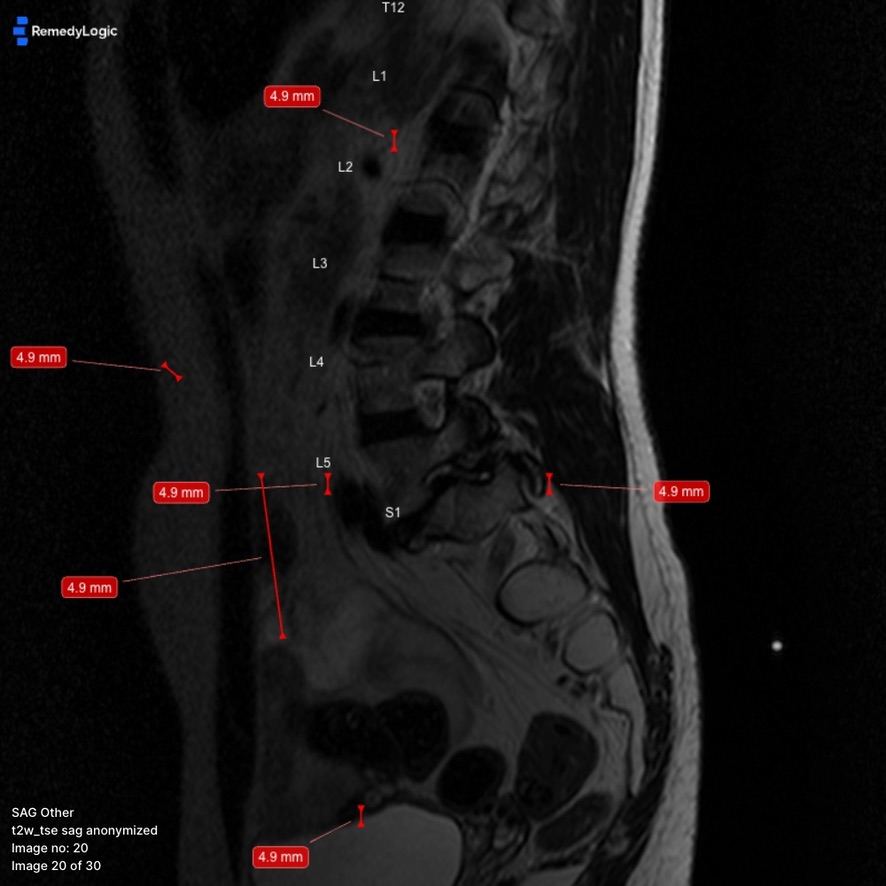
CoLumbo, from Smart Soft Healthcare, is the one product that does the hard thing. It puts several kinds of measurement onto the anatomy of a lumbar MRI slice, each value on the caliper that took it. Its own published frames are the best evidence of what the approach runs into.9
Three things on those frames. An area stands on the lower border of the sac it measures. A value inside the sac is crossed by two nerve-root contours. A cross-reference line runs through a level name.10
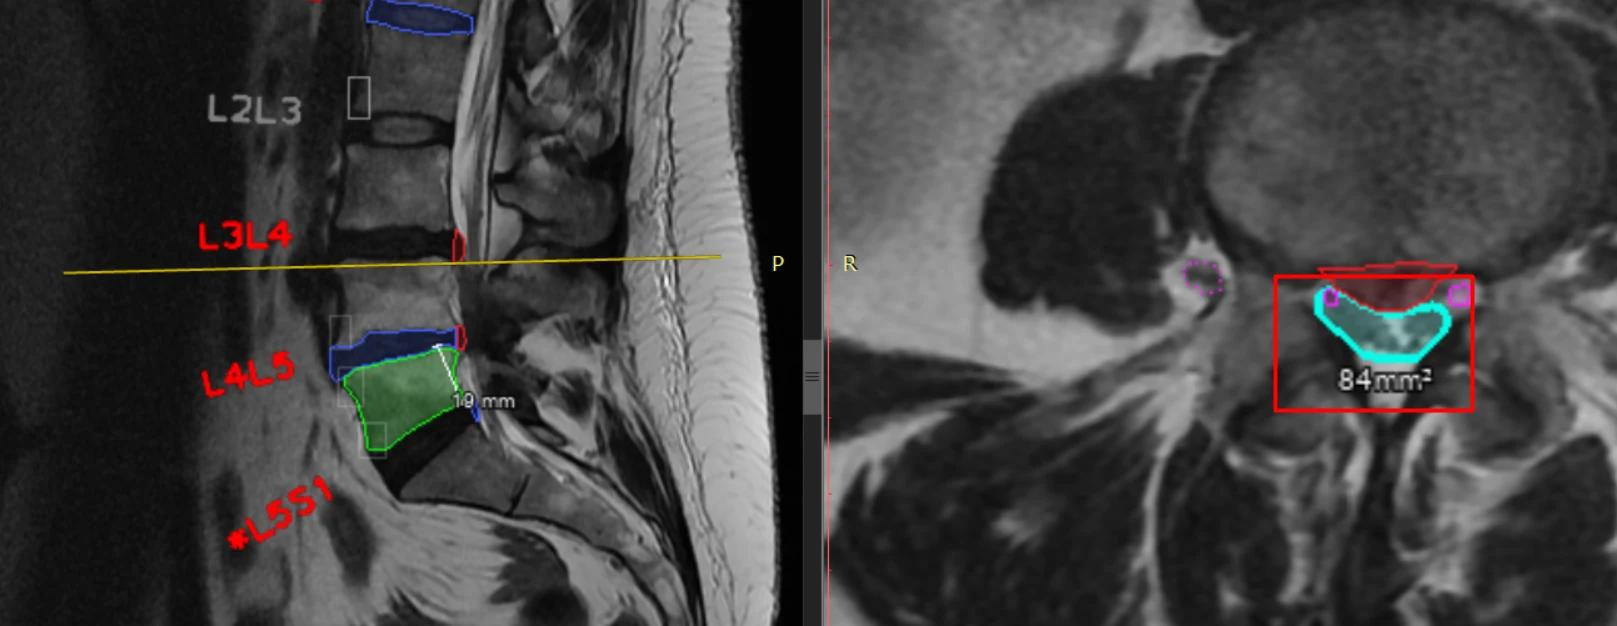 Chosen by the people who built it, to show the feature working. Screenshot: CoLumbo, Smart Soft Healthcare — columbo.me/help/dural-sac-area/
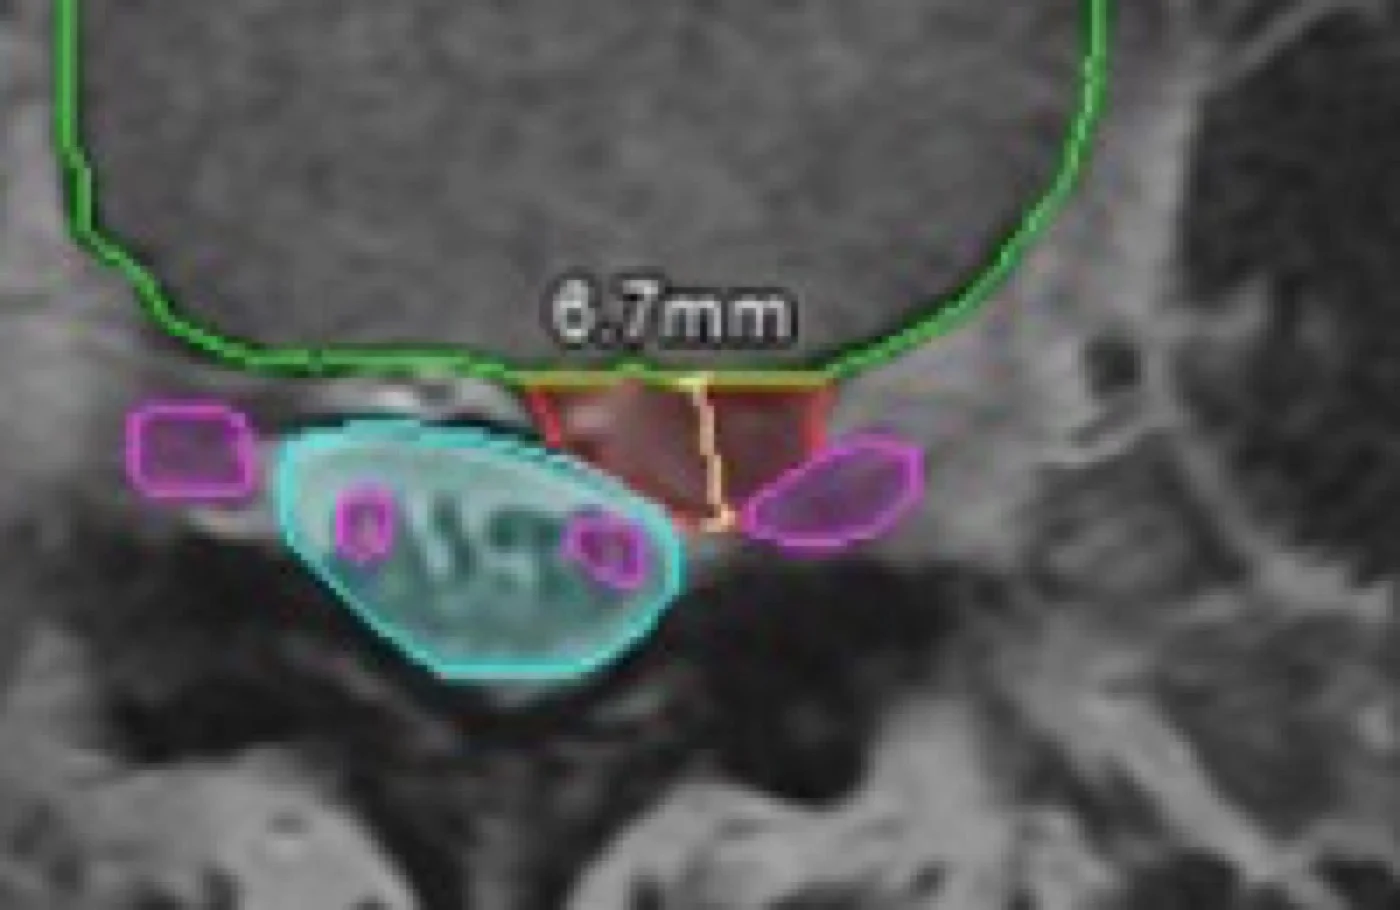 Screenshot: CoLumbo, Smart Soft Healthcare — columbo.me/help/disk-herniation-size/
One rule accounts for all three: the value goes where the measurement ended. That is a drawing rule rather than a placement system. It has no answer for two things that want the same pixels.
Every one of those three is impossible here, by design. Everything already on the frame declares the room it occupies before a label is placed. Anatomy, panels, level names, other labels. An arrangement that puts a plate on a shape is refused before it is scored, so it cannot win by being better elsewhere. What is left to trade is leader length, and a leader is the one thing a reader can follow back.
Which is why the library was written as the one thing every consumer draws from, rather than as the labelling inside a single viewer.
Four rules that cannot all hold
Take an axial lumbar slice. That is the plane where the disc, the canal and the nerve roots are seen together. A couple of hundred pixels of dense grey, with a dozen calipers inside them. Each wants a legible label near its own point. Four rules say where it may go:
- No two labels may overlap.
- No label may sit on the anatomy it describes.
- No leader may cross another.
- Every label has to be drawn.
Any one of them is easy. All four together are impossible. That is the whole job.
Contours are the easy half. A contour sits where the image put it. Two of them never argue about which one moves. A label has no place of its own. Its position is chosen, and every choice takes pixels from something else. Ten labels on leaders is a packing problem. On a dense slice it can have no solution at all.
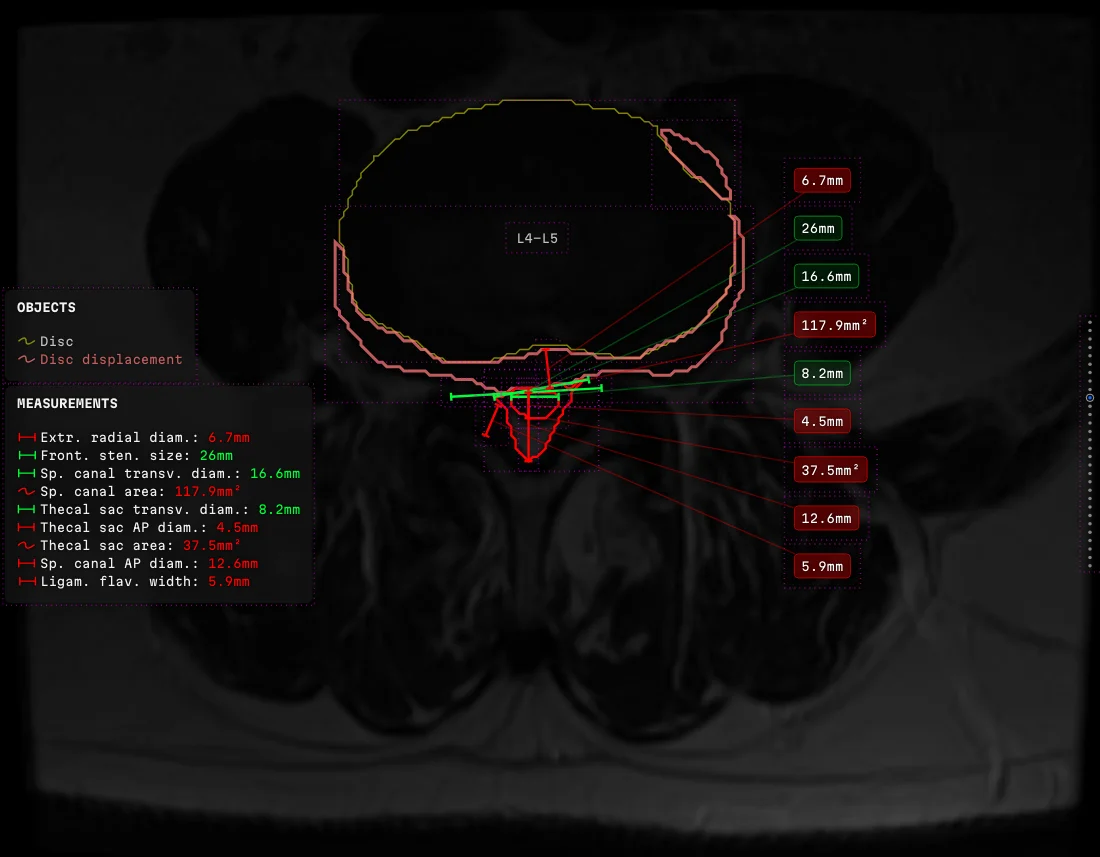 The case in question, solved, with the layout guides switched on. Nine measurements of seven different quantities. The dashed rectangles are the room each object claimed before anything was placed.
Middle-out
The first version did not search. It offered a label forty-two positions in a fixed order and took the first that fitted. If all forty-two failed, the label was not drawn at all. Forty-two positions felt like thoroughness at the time.
When nothing fitted, the code drew nothing. That is the one outcome the rules exist to forbid.
What replaced it sent the labels out from the centre like a fan. Each one travelled away from its own measurement until it found clear space.
Middle-out.
It looks orderly. That is what makes it deceptive. A label buys clear space with leader length. A longer leader crosses more neighbours. Sending every label as far out as the frame allows maximises the very quantity that needed minimising.
The idea was elegant. The pictures were a mess.
Letting a crowded label leave its column and find its own room came next. Every version made a better frame and a worse stack. The same measurement landed somewhere new on each slice, so the reader had to hunt it down again at every one. That mechanism was deleted too. A predictable crowd beats an unpredictable position.
How a crowded picture is read
The eye fixates. It takes in a small sharp region. Then it jumps, and throws away everything between. A label beside its measurement sits inside the same fixation and costs nothing. A label at the far end of the frame costs a jump out and a jump back. The value has to be held across both. For one number.
The clinical question settles how labels group. A reader wants the same quantity at adjacent levels: canal diameter down the lumbar spine, disc height above and below. Six numbers clinging each to its own point are six searches. The same six in a column are one region and one movement of the eye.
Occlusion is the one rule with no acceptable amount. A label over the anatomy it describes destroys the evidence for its own claim: the number is standing on the thing the reader would check it against. Elsewhere that is cosmetic. Here it is a finding nobody can verify.
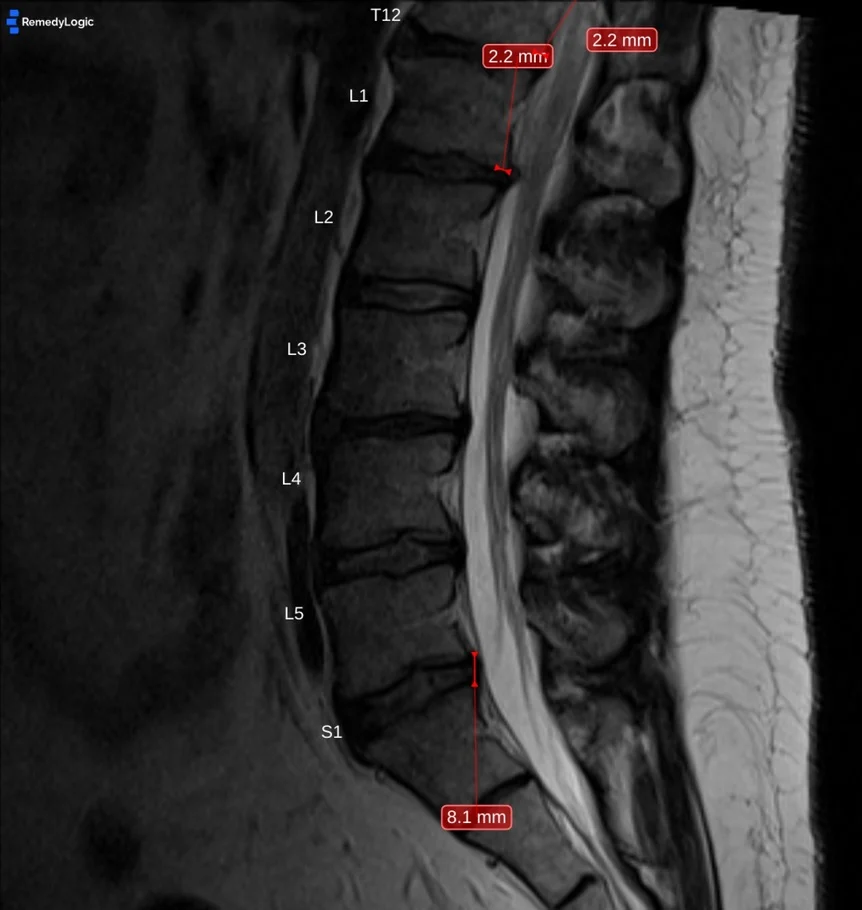 Two measurements of the same size want the same point. The loser ends up outside the frame.
Searching instead of trying
The forty-two tries gave way to a search. No formula gives a position. The constraints contradict each other, so any closed form that satisfies one breaks another. What exists is a space of arrangements, most of them bad. The work is searching it against two tiers and a fixed order of sacrifice:
ranking: # how a whole arrangement is judged, top down
  refuse: [leaders_crossed, plate_on_shape]
  concede: [leader_over_reading, leader_over_plate]
  settle: [longest_haul, haul_evenness, haul_sum]
budget:
  reseat_rounds: 9 # how often one plate may be reseated
  step_rungs: 5 # how far along the ladder it may be pushed
  exhausted: return_best_seen # never empty, never an error
The order inside the settling terms runs against instinct. Score the spread first, and "push everyone equally far" beats "leave almost everyone alone". A reader tolerates a crowd of short leaders and refuses one number exiled across the frame. So the longest single haul is scored first.
The first search took the first arrangement that satisfied the hard rules. A reasonable thing to do. It produced visibly worse pictures than it had to.
An arrangement that breaks no rule can still be the wrong picture.
It is scored as a whole composition now, and the search returns the least damaged arrangement. The first scoring counted violations and took any move that lowered the count. Repairs have a price ceiling now.11
Order, not room
Labels are gathered into columns, so every leader in a column arrives on the same vertical. For any two of them, crossing comes down to the order they sit in. It is a property of the assignment. Two labels can have all the space in the world and still cross.
The repair is small. Take a pair and swap their slots. Keep the swap only if the total number of crossings went strictly down. A column already clean comes out identical, which is what made it safe to ship.
Nobody counted crossings before that. A comment in the code asserted that sorting labels by the height of their points made crossings impossible, and on the strength of that one sentence they never were.12
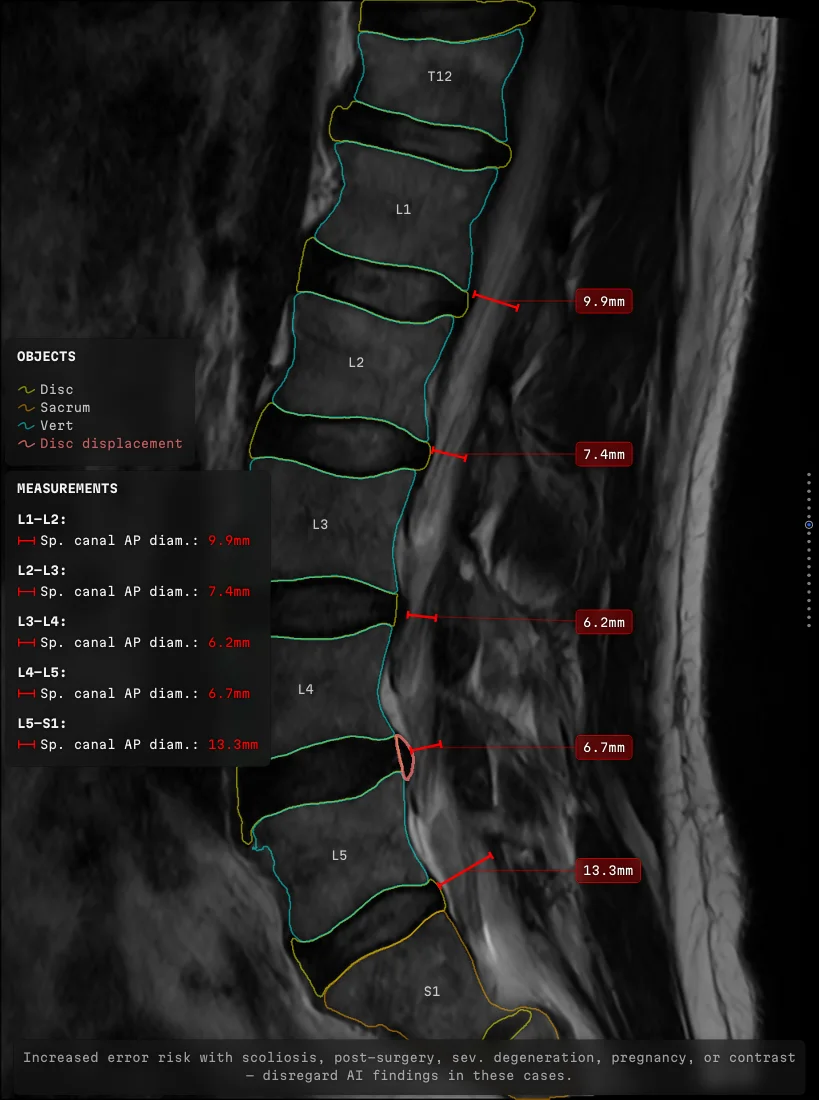 One movement of the eye down the column, in place of five searches across the frame.
Order settles which slot a label takes. Where the column stands is answered by the anatomy rather than by the window:
ladder:
  lanes_per_side: 4 # verticals available on each side
  stands_off: anatomy # pinned to the shapes, not to the frame
  gap_from_anatomy: 24 # clearance from the outermost shape, px
  lane_width_percent: 130 # of the widest plate in it, margin included
crowding:
  never: compress_gaps # the space between plates is never taken
  outer_lane: folds_inward # it collapses, its plates move in
  inner_lane: pulled_off_wall # the last one steps back from the edge
Away from the line
When a label does not fit where it wants to be, it moves away from the measurement line. Away, and only away. The leader then leaves at a sensible angle instead of doubling back over its own measurement. A moved label pushes its neighbour, so the rule has to hold at every step of the chain.
The version that read best on paper spread a column symmetrically about its anchor. It moved the label nearest the measurement towards the line, and towards is the one direction the rule forbids.13
What a label has to go round
What a label has to avoid is declared on the thing to be avoided, as one number:
vertebra: { clearance: 14 } # go round, and hold 14 px clear
disc_quiet: { clearance: ~ } # not an obstacle: write over a calm level
disc_bulging: { clearance: 0 } # hug the outline, which is not off
board_left: { clearance: 5 } # a panel obstructs like anatomy
caliper_arm: # no key at all -> the margin comes from the kind,
  kind: reading # never from zero, because forgetting must not disarm
Labels are free to use the space over the levels nobody needs to look at. The keep-outs say where the interesting anatomy is by saying where not to write.
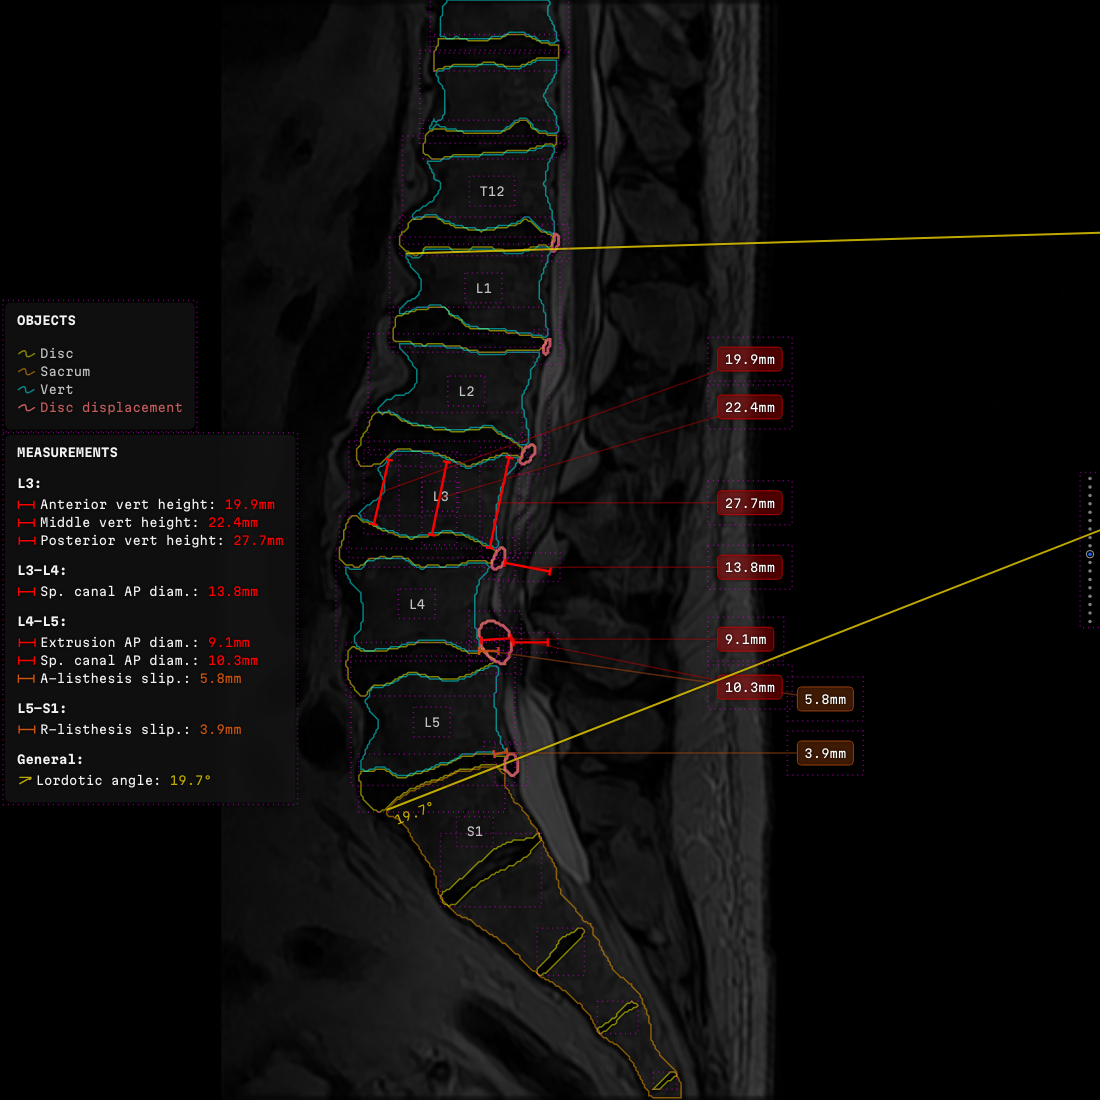 Every object on the frame declares a rectangle before anything is placed, labels and panels included. What the rectangles did not claim is the room the next label gets.
An area is a polygon, and the leader has to land on its boundary. The two obvious ways of choosing that point both fail.14 What works is a cost rather than a distance. Vertical offset is traded against horizontal reach, so the point chosen faces the label.
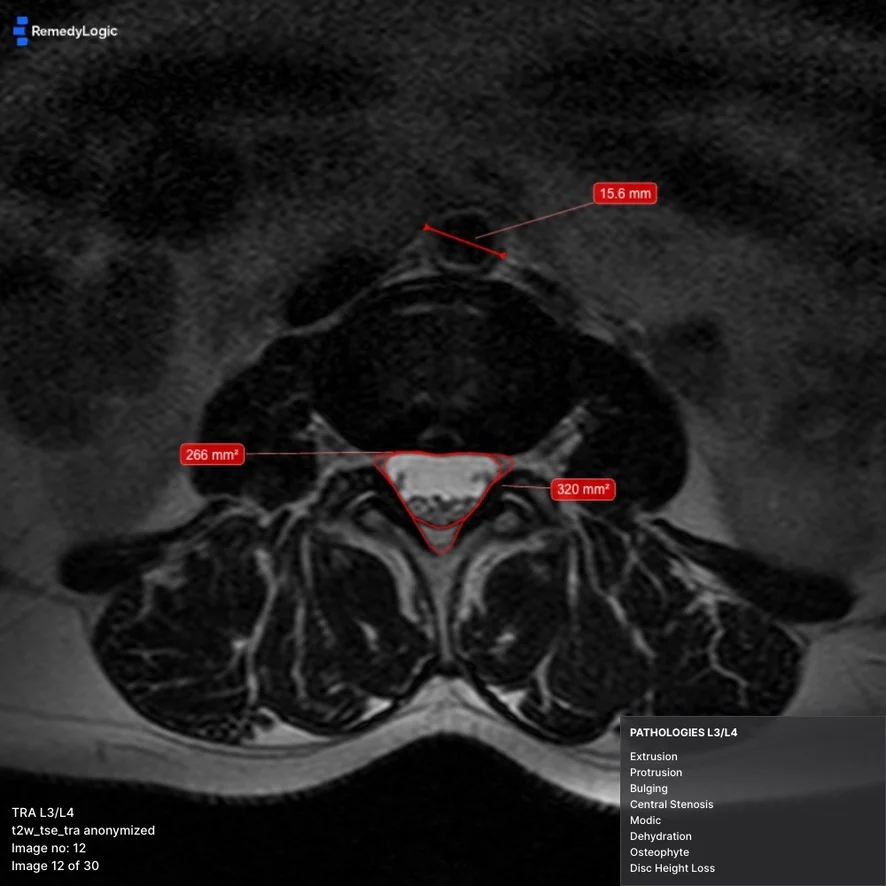 Each leader lands on the side of the boundary facing its own label. That took a cost rather than a nearest point. The findings panel sits in this corner on every slice in the stack.
One picture, three hosts
The three consumers see different worlds.15 The requirement is one sentence. The same study with the same configuration produces the same picture in all three, to the pixel.
A special case for one host is a different picture for everyone.
The drawing surface is a 2D canvas.16 Pixel identity across three hosts is a bitmap problem, and the canvas is the surface all three share. Text is measured by the canvas itself, so the font ships inside the library.17
There are four coordinate systems: the analyser's pixels, the layout's units, the screen and the device. Each has its own type and one named conversion across. A number from one used as a number from another now fails to compile. Every placement bug the library ever had was that mistake. Making it unrepresentable retired the class.
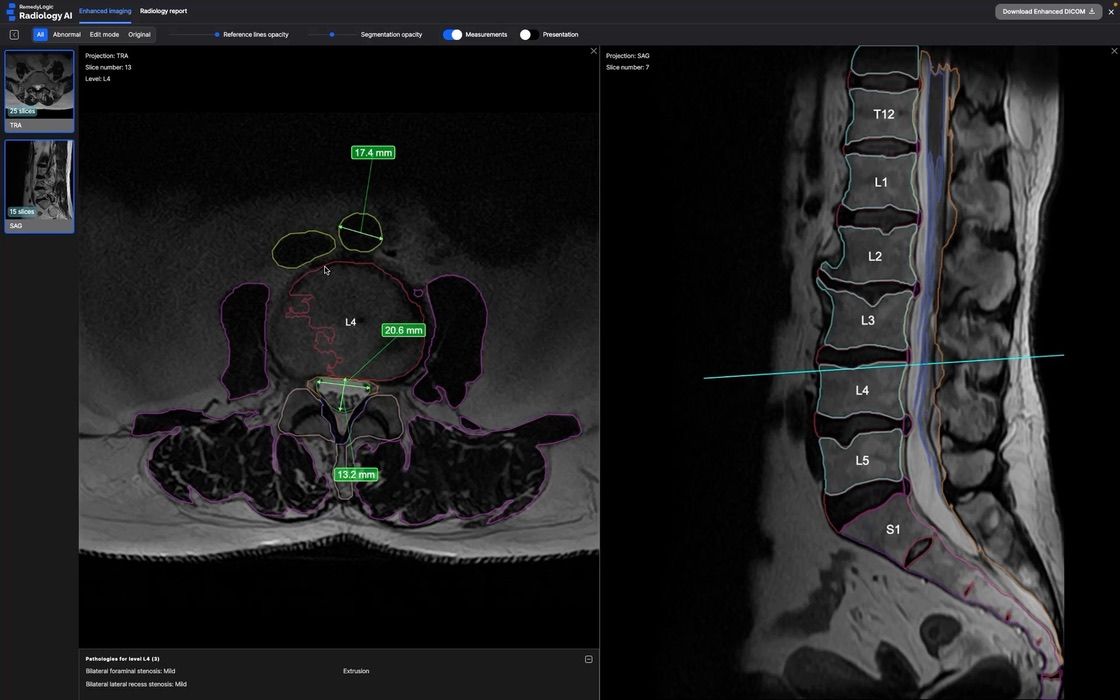 The live path: the same drawing code over a viewport the reader pans and zooms. Under a gesture the overlay adjusts nothing. It asks the viewer again where every millimetre has landed.
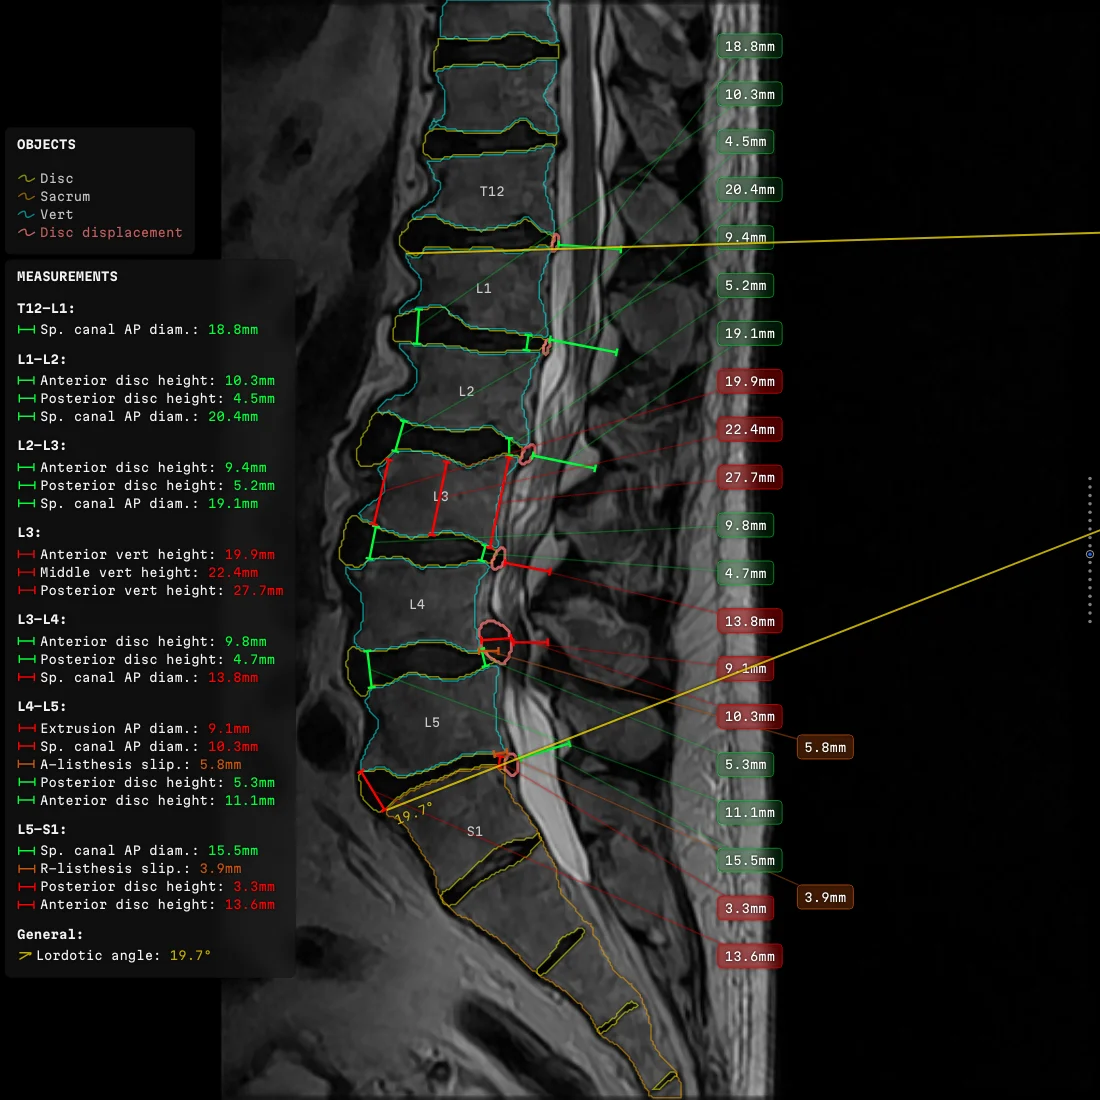
Behaviour is pinned by properties rather than by expected pictures.18 Behind them sits a corpus of slices, one for every placement defect ever found.
What it cost to learn
Rules the code calls inviolable. A label moves away from the line. A leader never cuts across a caliper. A column does not move. Each is written down as absolute. Each is in practice a concession the solver may buy at a price. The documentation had recorded the intention as the behaviour.
A mechanism that cancelled out. An outside review found a mechanism tying the layout to the height of the composition. A public property, a fallback constant, tests and a stack of documentation. All of it the author's own. The reviewers were unanimous: the quantity cancels out of every comparison the solver can make. The jitter it had been built to remove had been there the whole time.
Code can be correct, tested, documented, and still change nothing.
Fallback values in the code. They all came out. The configuration is the only source of truth. Almost none had ever fired, and several that could have were stale. After the removal the picture was identical to the pixel.
From part of one viewer to a standard
The library began as one JavaScript file inside a single viewer, with no tests and no way to run one. It has close to three hundred now. Twenty-five thousand eight hundred lines across sixty-two files, behind one published surface. The last production run drew 2738 slices across thirty-six jobs with no errors and no warnings. That had never happened before.
None of that is what sold it. The first prototypes stood at industry events while the engine behind them was still being built. The picture was enough. People stopped. Conversations turned into introductions and later into integrations. What stopped them was the slice with the findings already on it.
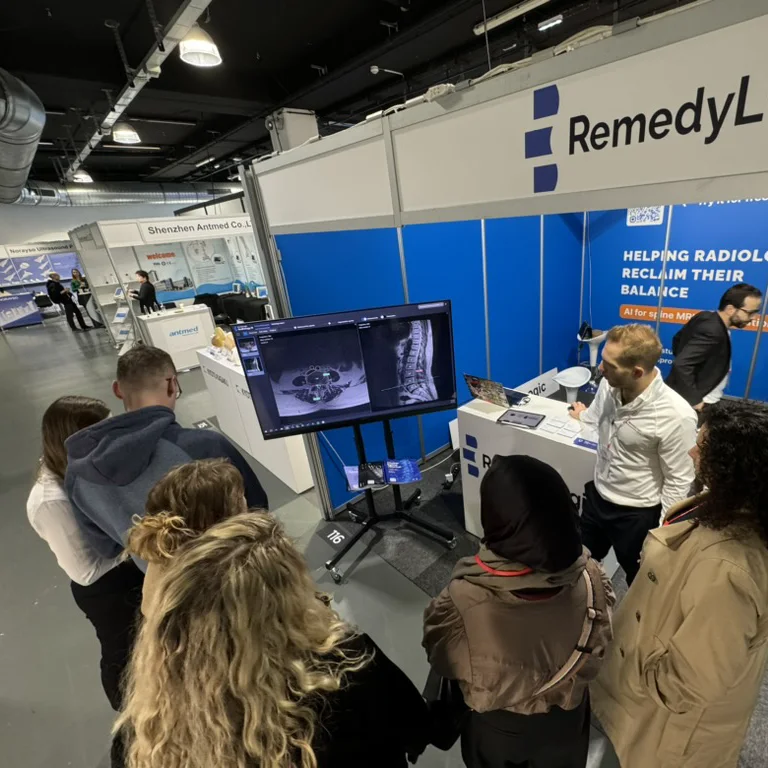
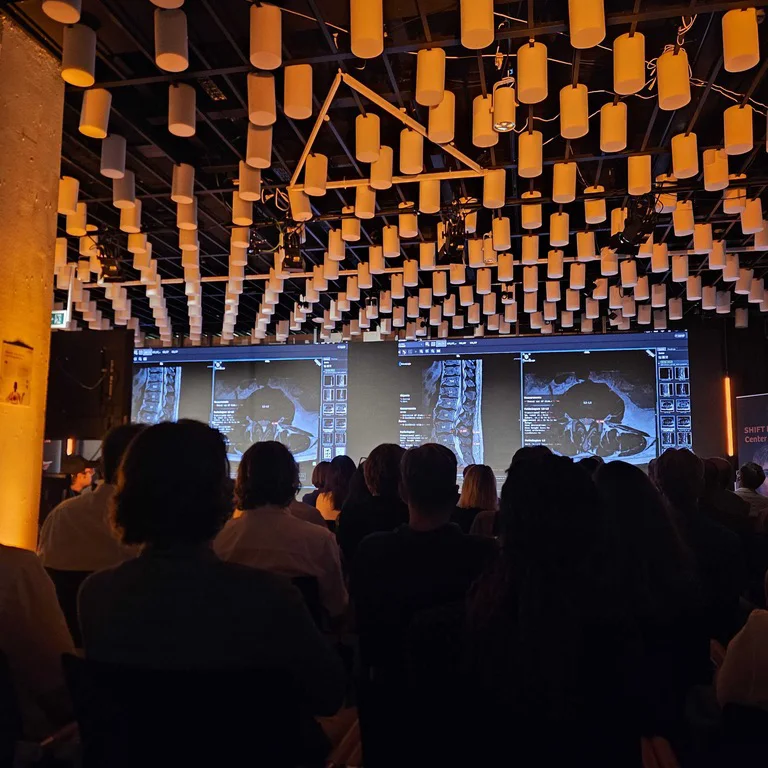
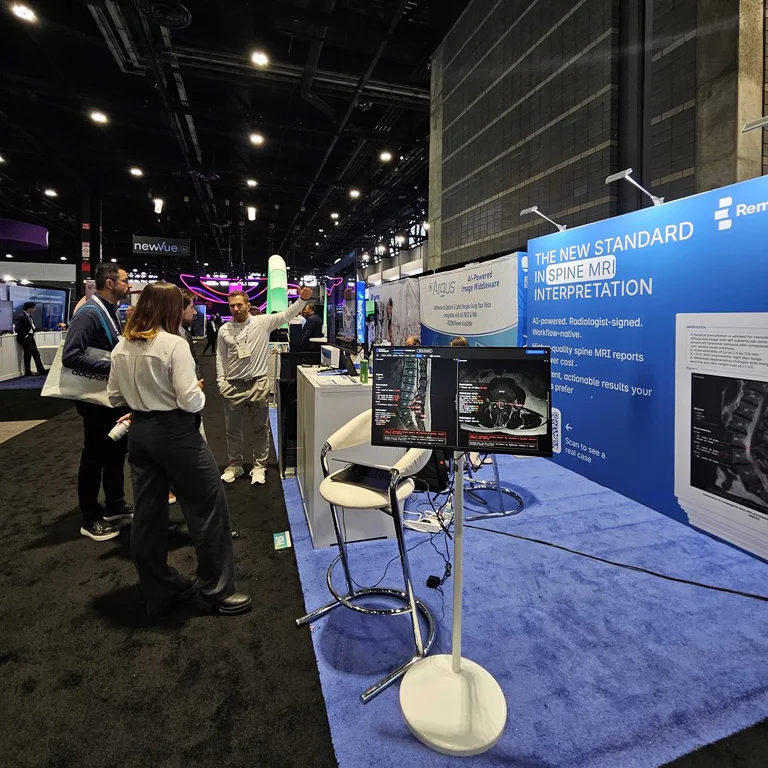
The library did the work silently but surely.
Footnotes
-
An MRI takes its pictures with a magnet and radio waves, and no radiation at all. It shows soft tissue, which is why a spine is examined this way: the discs and the nerves, not only the bone. A study is not one picture but stacks of thin slices, cut two ways. Sagittal cuts run down the body from front to back, so the spine is seen from the side with the levels one above the other. Axial cuts run across it, so a single level is seen from above, with the disc, the canal and the nerves in the same picture. Almost everything difficult in this post happens on an axial slice. ↩
-
These are the words a spine report is written in. A disc is the pad between two vertebrae, and a protrusion is that pad pushed out of place. The canal is the tunnel down the middle of the spine carrying the cord and the nerves; stenosis is that tunnel being narrow, which is what presses on them. Canal diameter is how wide it is at one level, in millimetres. A report is a list of such statements, level by level, and everyone who reads it afterwards has no picture in front of them. ↩
-
Brady, Error and discrepancy in radiology: inevitable or avoidable?, Insights into Imaging 2017, covering data back to 1949. The day-to-day rate quoted there is Berlin's, and retrospective review comes out at around thirty per cent. That retrospective figure is an average over targeted studies rather than a rate any one department measured, and the spread behind it is wide. ↩
-
Asmundo et al., Incidental diagnosis and reporting rate of abdominal aortic aneurysms on lumbar spine MRI, Quantitative Imaging in Medicine and Surgery 2025, for the 1922 patients. A separate series of 395 studies found an aneurysm in 9.6 per cent, reported in 10.5 per cent: Lumbar Spine MRI: Missed Opportunities for Abdominal Aortic Aneurysm Detection, Current Problems in Diagnostic Radiology 2019. Both count what the report mentioned, which is a different question from what the reader saw. The smaller the aneurysm the less often it appears, and in the second series most were under four centimetres. ↩
-
A 510(k) is how most medical devices reach the American market. The maker shows the Food and Drug Administration that the new device is as safe and as effective as one already sold there, and the agency clears it. Cleared is not the same as approved: approval is the heavier route, kept for devices that carry more risk. The number is the file, K241108 here, and what the maker wrote in it is binding. The sentence about who checks the output is one of those promises. ↩
-
The wording is the manufacturer's, filed with the clearance: the outputs "are reviewed, analyzed, confirmed or corrected by the user before any such content is included in the user's final report". It settles what the drawing is for. A claim the reader can check, and refuse. ↩
-
A headless browser is an ordinary browser with no window on any screen, started and driven by a program instead of by a person. It exists so that a server can render a page exactly as a reader's browser would and then keep the result as a file, rather than show it to anybody. Chrome runs this way from a switch on the command line. Here it means the frames are drawn by the same code that draws them live, on a machine with no screen at all. ↩
-
DICOM is the file format and the language of medical imaging. It was agreed in 1993 by the American College of Radiology and the National Electrical Manufacturers Association, so that a picture from one maker's scanner opens in another maker's viewer, with the patient, the machine and the settings carried inside the file. It also fixes how pictures are grouped: a study is one visit, and a series is one stack of slices inside that study. Here the drawn frames are added as a new series in the same study. That is why they arrive wherever the original arrives, and why no viewer had to be taught anything. ↩
-
The frames are the vendor's own, published on its help pages to show the feature working: one version, chosen by the people who built it. That makes them fair to reason from and no basis for a frequency. Nobody else in the niche puts this many kinds of measurement on the anatomy, so there is little else to reason from. A still says nothing about how often the crowding happens. ↩
-
The area on the sac's own border is on the vendor's dural sac area page, the value under two contours on herniation size. The cross-reference line through a level name is on the sagittal frame of the same pair. Each page was chosen to show the feature working, so these are the arrangements the vendor was content to publish. ↩
-
On a real slice the count-only scoring hauled one measurement a fifth of the way across the picture to spare its leader a single plate. The neighbour at the same level sat comfortably beside its own caliper. The count went down, so the move was kept. That is the arrangement the ceiling now refuses. ↩
-
The premise is false. Height decides where a leader ends, and where it leaves its caliper sideways decides its path just as much, so two labels sorted by height can still cross. Nothing counted crossings, so nothing complained for as long as the comment stood. ↩
-
Least total movement, tidy on a whiteboard, and the obvious answer. An independent pass over the placement found every hard rule satisfied and one thing wrong: the nearest label had travelled thirteen pixels in the forbidden direction. The rule is about direction rather than distance, so the size of the offset settles nothing. ↩
-
The nearest point on the boundary sends the leader back over itself, on exactly the shapes that matter. The point at the label's own height wanders round to the far side of the polygon. Both are cheap to compute, which is why they get tried first. ↩
-
The headless generator chooses its own frame size. The live viewport takes whatever the page left it, then gets panned, zoomed and resized. Underneath sit viewers built by other people, OHIF among them. ↩
-
A canvas is a rectangle of pixels inside a web page that a program paints into, one stroke at a time. It is part of the web standard, and every browser has one. It remembers nothing: once a line is painted there is no line any more, only coloured pixels, and nothing can be moved, asked about or re-wrapped afterwards. That is exactly why it is used here, since the same instructions give the same pixels everywhere. It is also why everything a page normally does for free — wrapping a line of text, drawing a plate behind it — had to be written from nothing. ↩
-
What the canvas answers depends on the platform's rasteriser and on whether the font had finished loading. A width measured before the face arrives is the width of a fallback. Shipping the file inside the library removes the second half of that. ↩
-
The properties: every label drawn, every label docked to its own column, plates and leaders clear of each other. All of it is measured on the rectangles the painter actually draws, rather than on the numbers the planner handed it. A property holds across every slice in the corpus at once. ↩